Tech
How To Optimise Your Flutter App for Performance (2026)

June 13, 2026
The fundamentals of a fast Flutter app haven't changed: use `const`, build lazy lists, keep heavy work off the UI thread, and profile rather than guess. What has changed is the engine underneath. Impeller is now the default renderer on iOS and Android, and the shader-compilation jank that older performance advice tiptoed around is largely gone. So a 2026 tune-up is partly about applying the timeless techniques and partly about retiring habits that no longer earn their keep.
I'm Gareth, CTO at Foresight Mobile. We've built and maintained production Flutter apps since 2017, and we now maintain a core Flutter package (`flutter_markdown_plus`, 140,000+ weekly downloads), so a lot of this comes from fixing real apps rather than reading the docs. This is the refreshed 2026 version of our optimisation guide, anchored to Flutter 3.44 and Dart 3.12.
Speed is a feature. A janky scroll, a slow cold start or an animation that stutters reads as "cheap" long before a user can articulate why, and they leave a review or delete the app. Smoothness also costs less battery and runs better on the mid-range Android phones most of your audience actually owns. Performance isn't polish you add at the end; it's a property you protect throughout, and the best Flutter apps we build are designed for it from the first screen.
If your mental model of Flutter performance still includes "warm up your shaders to avoid first-run jank", it's out of date. The old Skia renderer compiled shaders at runtime, the first time each effect appeared, which caused the notorious stutter on first launch or the first run of an animation. Teams worked around it with an SkSL warm-up step.
Impeller, now the default renderer since Flutter 3.27, removed that whole class of problem. It pre-compiles a small, fixed set of shaders ahead of time, so there's no runtime shader compilation and frame timing is predictable. On iOS it's the only engine now; there's no switching back to Skia. On Android it's the default for API 29 and above, and the ability to opt out was deprecated in Flutter 3.38, so it's on its way out. The practical upshot: the SkSL warm-up step is no longer needed, cold-start animations are smoother out of the box, and you can spend your optimisation effort on the things that still matter.
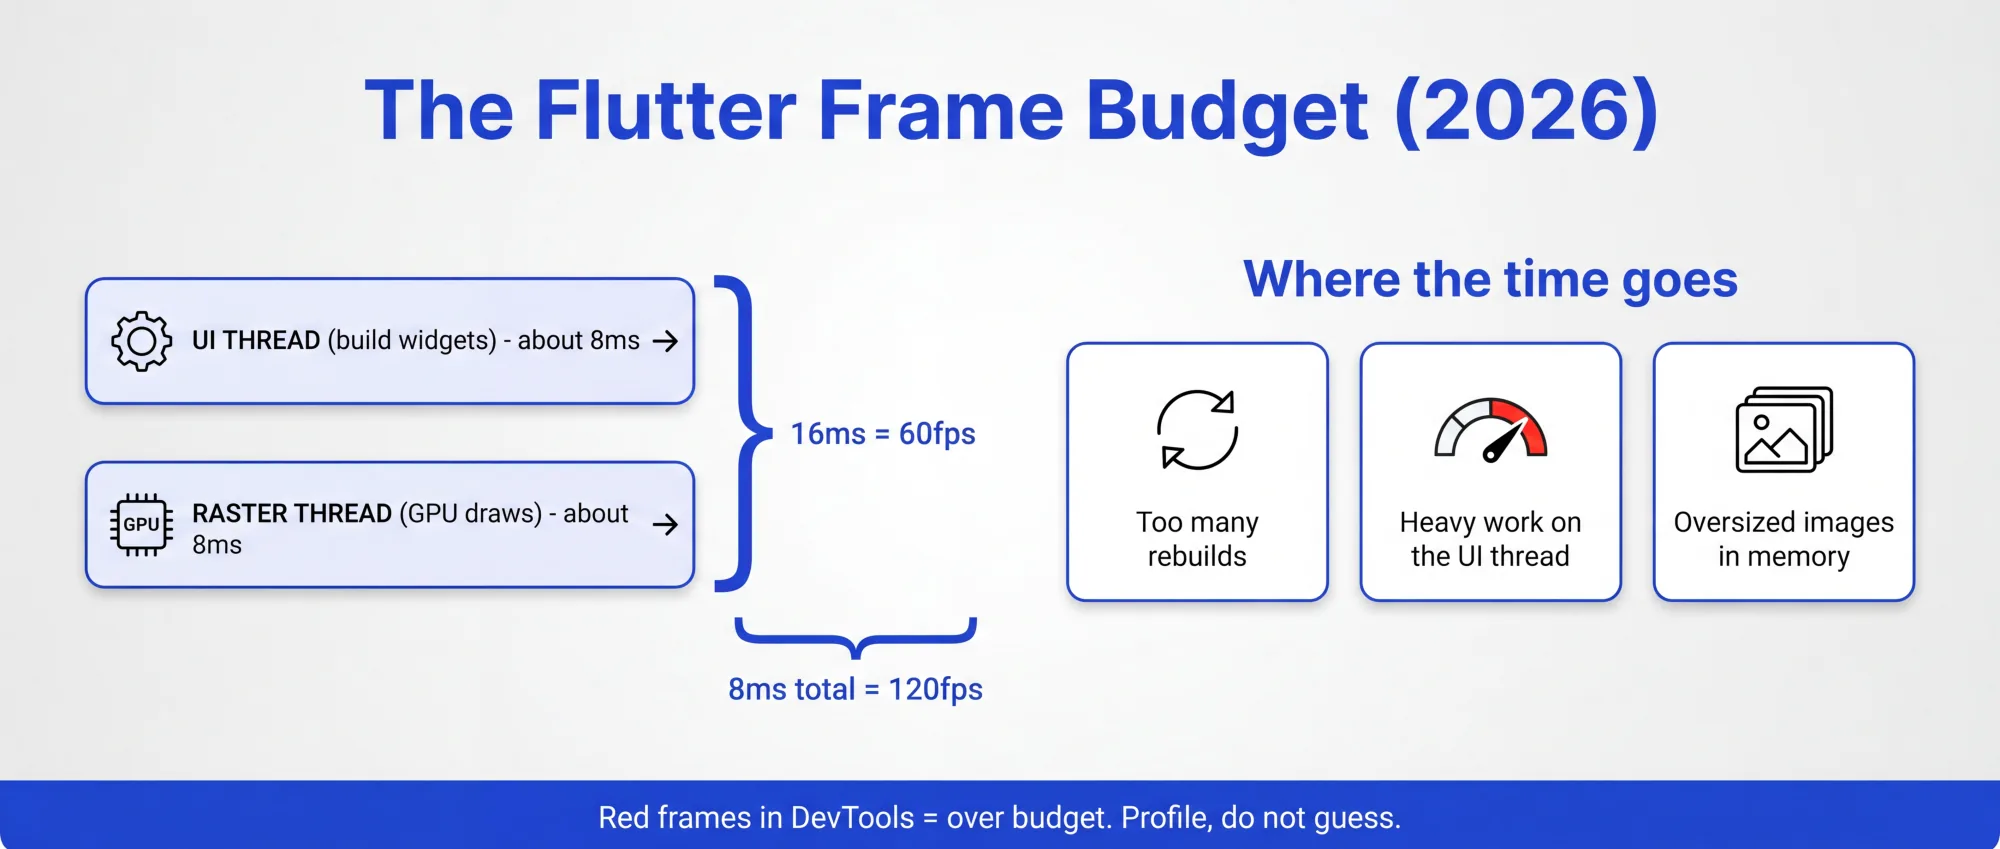
A 60Hz display gives you 16 milliseconds per frame. The catch is that Flutter does its work on two threads, the UI thread (your Dart code building widgets) and the raster thread (the GPU drawing them), so in practice you have roughly 8ms for build and 8ms for raster to hit 60fps comfortably. On the 120Hz displays that are now common, the whole budget shrinks to about 8ms. So the target isn't "just under 16ms", it's "well under", which buys you headroom on low-end devices and keeps thermals and battery in check.
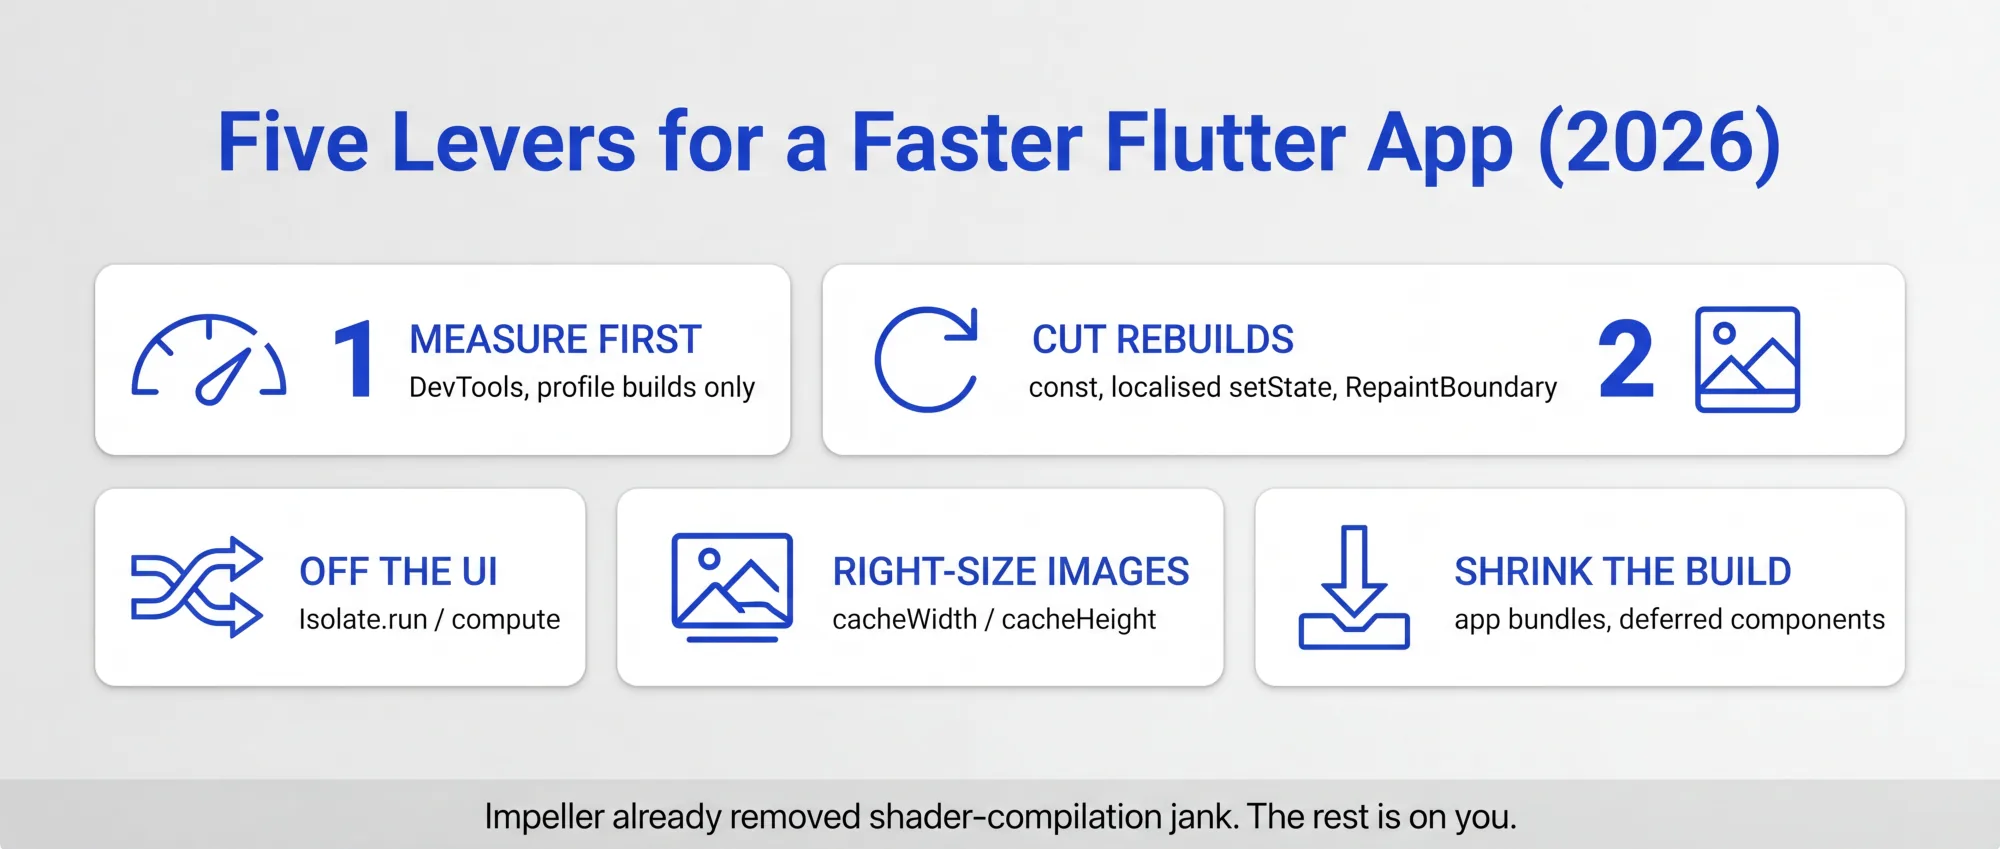
The single biggest mistake in performance work is optimising the wrong thing. Don't guess, profile. Flutter DevTools has become genuinely good at telling you where the time goes.
Open the Performance view and you get the Flutter Frames chart: colour-coded bars splitting UI-thread work from raster-thread work, with any frame that blows the budget shown in red. The Frame Analysis tab gives you automated hints pointing at the expensive operation in a janky frame. Turn on Enhance Tracing (Track Widget Builds, Track Layouts, Track Paints) to see exactly which widgets are rebuilding, laying out and painting, and how often. The CPU profiler, Memory view and Timeline round it out. One rule that matters: always profile a profile build, never a debug build. Debug builds carry hot-reload overhead and will lie to you about real performance.
Most Flutter jank on the UI thread comes from rebuilding more widgets, more often, than you need to. The fixes are cheap:
For lists and grids, always use the lazy builders, `ListView.builder` and `GridView.builder`, so only the visible items are built. Never hand a long list a concrete `children` array. (The 2024 version of this post reached for a third-party paged list; the built-in builders are the right first answer.)
Watch out for `saveLayer()`, which allocates an offscreen buffer and is one of the most expensive things you can trigger on a mobile GPU. It hides behind `ShaderMask`, `ColorFilter` and overflow-shaded text. Avoid the `Opacity` widget inside animations; use `AnimatedOpacity`, `FadeInImage`, or apply opacity to the image directly. Prefer a `borderRadius` over an explicit clip. The checkerboard-offscreen-layers overlay in DevTools shows you where `saveLayer` is firing.
This is the fix the old post only gestured at. All your Dart runs on a single main isolate with one event loop, and any computation that takes longer than a frame blocks rendering and causes jank. Here's the part people get wrong: `async`/`await` does not help with CPU-bound work. An awaited function still runs on the main isolate; it just yields at the await points. Parsing a big JSON payload, processing an image, or doing a heavy local-database read will still freeze your UI.
The fix is an isolate. `Isolate.run()` is the modern one-liner: it spawns a separate isolate, runs your callback there, returns the result and cleans up. Flutter's own docs use decoding a 20MB JSON file as the example. `compute()` is the cross-platform wrapper to reach for when you also target web. For work you do repeatedly, spin up a long-lived isolate rather than spawning a fresh one each time, since spawning has its own cost.
Images are the most common memory hog in a Flutter app, and the fix is one parameter. By default Flutter decodes an image at its full resolution even if you're showing it tiny. Set `cacheWidth` and `cacheHeight` (or use `ResizeImage`, or `memCacheWidth`/`memCacheHeight` on `cached_network_image`) and it decodes at the size you actually display. Flutter's docs give the headline example: a 4K image shown at 384×216 uses about 330KB with cache dimensions set, a roughly 100x memory reduction. The best version of this has your server return the intended dimensions alongside the image URL so the client never over-decodes.
A smaller download converts better and installs faster. The levers:
Performance regresses. Features land, dependencies update, a new OS version changes behaviour, and the smooth app you shipped picks up jank you didn't write. The teams whose apps stay fast profile every release rather than waiting for a one-star review. That's exactly what our app support and maintenance service is for. And if you've inherited a Flutter app that's already slow or janky, that's the bread and butter of our app rescue service: we profile it, find the real bottleneck, and fix it.
If you want a Flutter app built to be fast from the start, or an existing one made fast again, get in touch.
What is the single biggest Flutter performance win in 2026?
For most apps, getting heavy work off the UI thread with `Isolate.run` or `compute`, and right-sizing images with `cacheWidth`/`cacheHeight`. Both target the two most common causes of jank and memory pressure. But profile first with DevTools so you fix the real bottleneck, not a guessed one.
Do I still need to warm up shaders in Flutter?
No. The SkSL shader warm-up step existed to work around runtime shader compilation in the old Skia renderer. Impeller, the default since Flutter 3.27, pre-compiles shaders ahead of time, so that first-run jank is gone and the warm-up workflow is no longer needed.
Why is my Flutter UI freezing even though I used `async`/`await`?
Because `async`/`await` doesn't move CPU-bound work off the main isolate; it still runs there. A long parse or computation will block frame rendering. Move that work to a separate isolate with `Isolate.run()` or `compute()` and the UI stays smooth.
How do I measure Flutter performance properly?
Use Flutter DevTools in a profile build (never a debug build). The Performance view's Frames chart shows UI-thread versus raster-thread time and flags over-budget frames in red, and Frame Analysis points you at the expensive operation. The App Size and Memory tools cover the other two dimensions.